
What level of instruction do you provide to your staff if they must undertake periodic maintenance as part of their job? Are the instructions that you provide clear enough so that they won’t be misinterpreted? Do they contain enough detail, so your staff members are crystal clear on what they have done and what is yet to be done?
Mid last year a global manufacturing company that installs and services their conveyor belt equipment approached us to enhance their maintenance regime. There had been a minor safety incident at one of their client sites and although that particular issue was minor, they were concerned that if a conveyor belt was not taken apart or put back together in the correct sequence that could lead to a more serious safety incident. With hundreds of buckets on a conveyor belt and each bucket weighing between 5 and 20 kilograms the impact that the buckets could have if they hit someone could be fatal, especially on vertical conveyor belts that are used to transport grain up to silos.
The manufacturing company wanted to be pro-active and show their clients which buckets should be removed first, how far around the belt needed to be rotated before the next set of buckets are removed (as well as how long it would take to rotate the belt around to that position) and so on until all the buckets were removed from the belt. If the buckets were not removed in the right sequence, the conveyor belt could become unbalanced, and the belt and buckets could slip out of their tracks.
They then needed the same thing in reverse after the belt had been inspected and all the buckets had to be re-installed on the belt. The re-installation needed to be done in a particular sequence to make sure the belt was properly balanced throughout that process.
To make it as clear as possible to the maintenance team we decided to develop a dashboard with both tabular and visual information to cater for both people who like to see information laid out in tables and those who like to see the information displayed graphically. We developed the dashboard you can see below in Figure 1, where the circle on the left-hand side of the screen is a visual representation of the conveyor belt and the buckets on the conveyor belt that are to be removed are shown in red, buckets that have already been removed are shown as white, installed buckets are shown as black. As staff are provided with instructions on how much they need to rotate the conveyor belt, the image of the conveyor belt was also rotated on the dashboard. The information on the right-hand side of the screen is also the metadata related to this particular maintenance sequence.
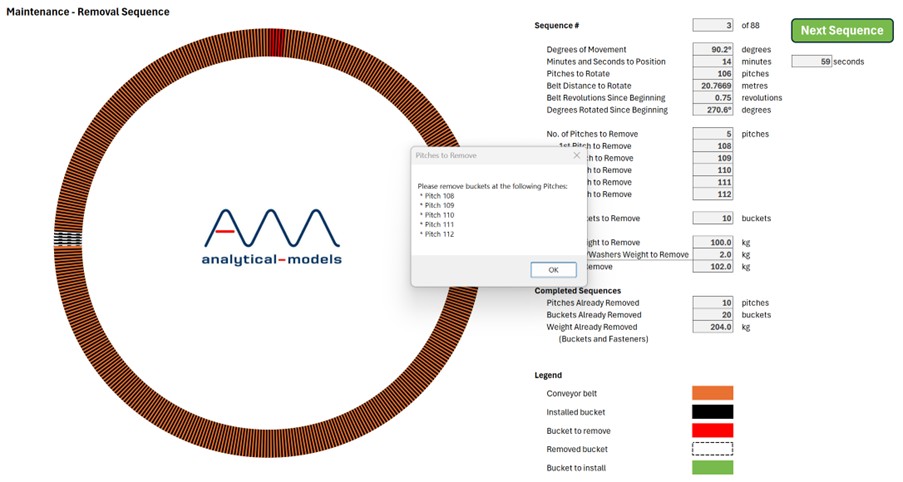
Figure 1: Specific bucket pitches are identified for removal. Buckets to be removed are shaded in red. Sequence metadata is included to the right of the belt visualisation.
The software had three different modes related to installation, removal and re-installation. At the start of each sequence in every mode the particular pitches that needed to be removed (or added) are in the information box shown to the maintenance team as shown in Figure 1. The maintenance team need to acknowledge those pitches before they can proceed.
The buckets that need to be removed are shaded in red. Additional metadata is provided related to the a) how many degrees the belt needs to be rotated b) the number of pitches by which the belt needs to be rotated before the buckets can be removed c) how long it will take for the belt to rotate to the right position. Supporting metadata is also provided, e.g. the number of belt revolutions since the mode started, number of buckets to remove and the weight of the buckets and fasteners removed.
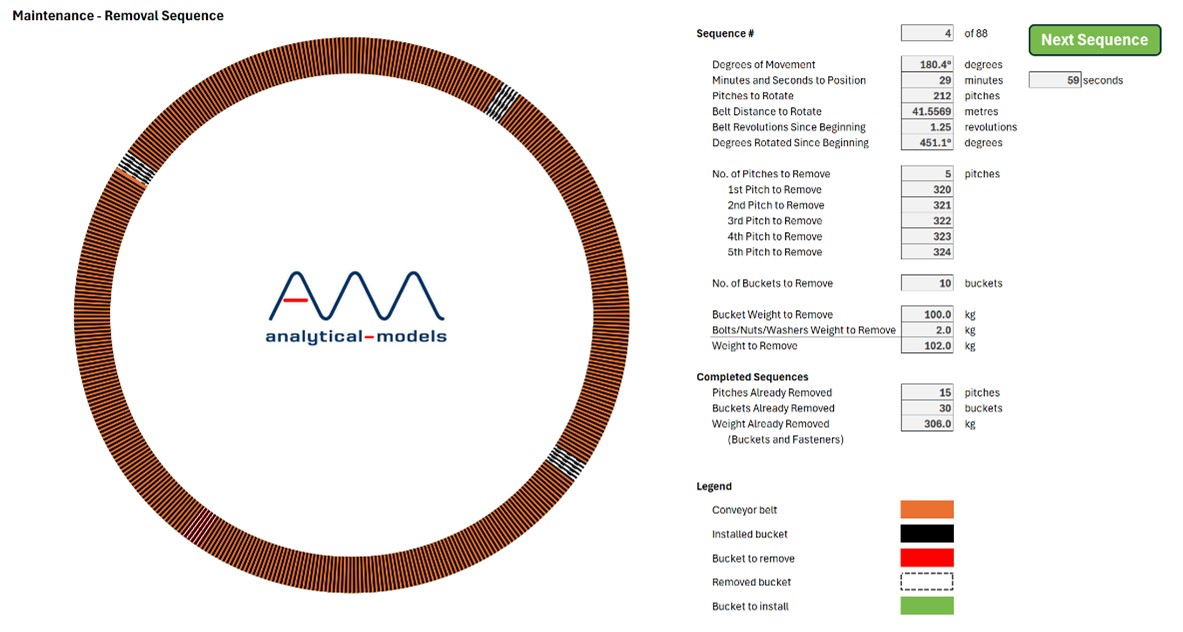
Figure 2: Removed buckets are shown in white and rotation sequence is visualised for the maintenance team
The maintenance team then see the conveyor belt rotating around until it reaches the right position for the buckets to be removed. This visual, along with the supporting tabular metadata helps the maintenance team to feel confident that they are following the sequence in the correct order which is great feedback for them.
Communicating the detailed instructions via the use of a dashboard and visuals, certainly raises the bar in terms of providing clear instructions for installation and maintenance. But from a record-keeping perspective we saw that there was an opportunity to keep better records.
We saw the opportunity to further enhance the dashboard by getting the maintenance team to provide the name of the Leading Hand and the full names of the maintenance team. And then, we took snapshots of the dashboard at the start and end of every sequence within a mode with times tamps so the date and time of the start and end of each sequence was also captured. So, we now had a full record of what steps were to be done, when they were to be done and who was involved in the process.
Are you keeping a log of what is happening for the critical processes in your business? If you have one, it will certainly help substantiate that you were making a significant effort to make sure the critical processes were being completed correctly. This can be particularly useful if you needed to provide any evidence. If you are not doing this at the moment, there are probably some quite simple steps you can take to capture this information.
Being proactive, especially when it comes to safety, is incredibly important. This simple dashboard provided value to the manufacturer, their client and the maintenance team. Having such detailed and clear information for each sequence of every mode is really helpful and keeping a timestamped log of what actually happened is invaluable if any incidents were to occur. How exact and safe are your maintenance regimes? A small investment can go a long way towards raising the bar on your safety credentials.