Yes, this post is quite specific, but I seldom see these functions used by other spreadsheet modellers even though I find they can be very useful, so I thought I’d write a few lines to share why I find them so useful.
I am talking about SUMIFS, COUNTIFS, MAXIFS etc. great formulae for dashboarding.
A real quick refresher for those unfamiliar. These are extensions of the COUNTIF and SUMIF functions that allow you to put multiple criteria into a single function and get either the count of how many records meet your criteria or the sum of a particular column for all matching records.
The syntax used are as follows
COUNTIFS = COUNTIFS(criteria1_range,criteria1, criteria2_range,criteria2,…)
and
SUMIFS = SMIFS(sum_range, criteria1_range,criteria1, criteria2_range,criteria2,…).

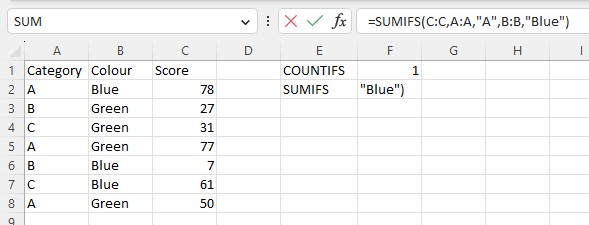
Figure 1: SUMIFS in Action
In the screenshot above, the formulae bar shows an instance of the SUMIFS formula in action. The formula is summing the score in Column C for all records which are in Category A and who have a colour of Blue.
I find these formulae very useful for dashboards as they allow you to make a dashboard far more dynamic and interactive. Simply, by exposing the criteria as drop-downs in your dashboard with all the unique values associated with a field it allows your user to modify the report to find out the exact information they want.
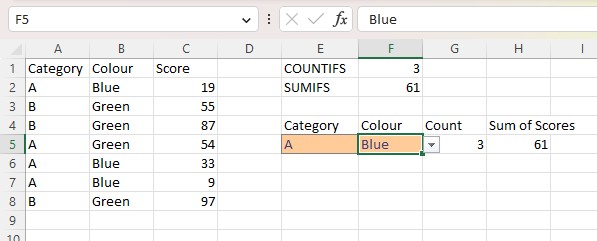
Taking the very same example from above and providing drop-downs in cells E5 and F5 for the criteria allows users to easily change the configuration and see the count and sum of scores.

Figure 2: SUMIFS with Criteria Exposed to User in cells E5 and F5
You also have the use of ? and * characters to use in the criteria. For example, if you set the colour to * then you would get all records from category A no matter what their colour.
The *IFS function also allows you to work with raw and granular data that is not necessarily contiguous so the data sets that you work with have a bit more shape flexibility. For example, they allow you to leave blank rows between data dumps which can be very visually helpful when adding data, e.g. to leave a blank row between each day’s data.
It does not get away from the fact that intermediary calculations are sometimes needed. But working in this way means that the intermediary calculations can most of the time simply be filled down which makes updating of the reporting quicker than re-extracting a full data set.

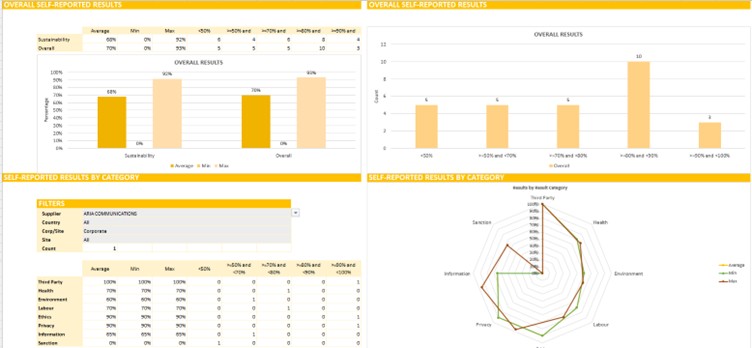
Figure 3: Including Dynamic Data Queries in a Dashboard
That is all for this post. I hope that COUNTIFS, SUMIFS and other *IFS formulae might be candidates for consideration in the future for your reporting work.
